Break-Even ROAS: How to Calculate the ROAS You Need to Be Profitable
Your target ROAS shouldn't be based on an arbitrary benchmark. Learn how break-even ROAS works, how to calculate it from your margins, and why different businesses need different ROAS targets.
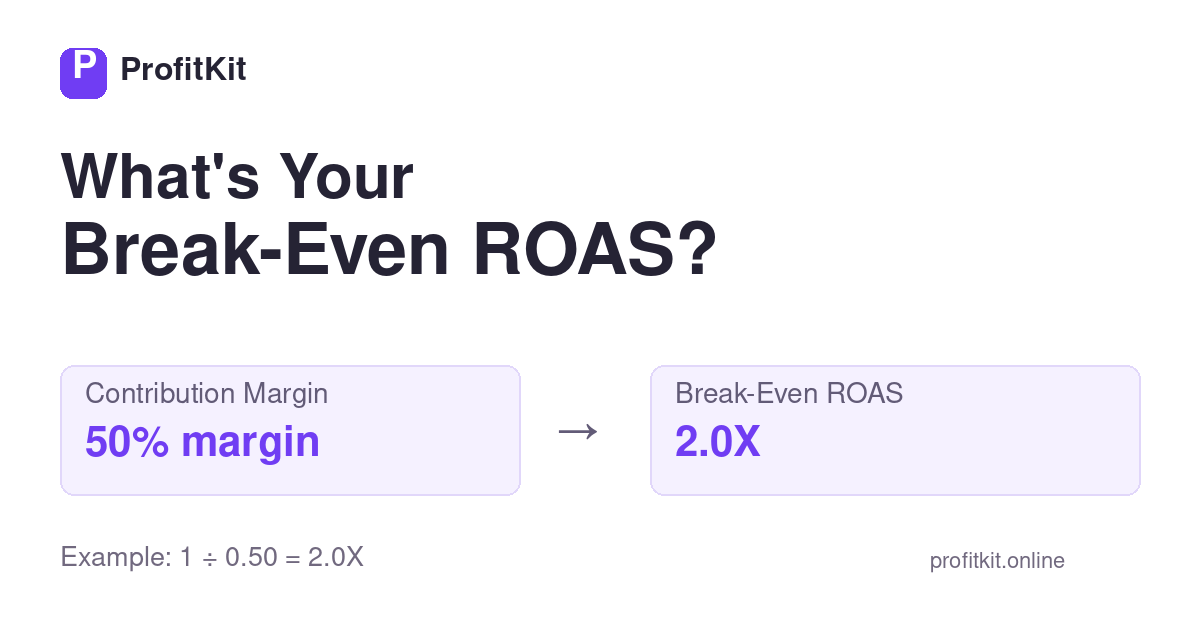
Is a 2X ROAS good?
What about 3X?
Or 5X?
There isn’t one correct answer.
A ROAS that produces healthy profit for one business could lose money for another.
The difference often comes down to margin.
Understanding your break-even ROAS gives you a much more useful benchmark for evaluating advertising performance than choosing an arbitrary ROAS target.
What Is Break-Even ROAS?
Break-even ROAS is the ROAS level where the revenue generated by advertising is just enough to cover the costs included in your calculation.
At break-even:
You’re not necessarily losing money, but you’re not generating profit under those assumptions either.
If your actual ROAS falls below your break-even ROAS, the campaign may be unprofitable.
If it rises above break-even, there may be room for profit.
The exact result depends on which costs you’ve included.
For the difference between revenue efficiency and profitability, see ROAS vs profit.
The Break-Even ROAS Formula
A common simplified formula uses contribution margin:
Contribution margin should be expressed as a decimal.
For example, if your contribution margin before advertising is 40%:
Your break-even ROAS would therefore be approximately:
2.5X
Under this simplified model, generating $2.50 in revenue for every $1 of advertising spend would cover the costs represented in that margin.
Example: Calculating Break-Even ROAS
Imagine an e-commerce product sells for:
$100
The variable costs associated with fulfilling that order are:
- Product cost: $35
- Shipping/fulfillment: $10
- Payment and other variable fees: $5
Total variable costs:
$50
That leaves:
before advertising.
Contribution margin:
Now calculate break-even ROAS:
The simplified break-even ROAS is therefore:
2.0X
At a 2X ROAS, $50 of advertising spend would generate $100 of revenue.
The remaining $50 would cover the $50 of variable costs in this example.
Profit under these assumptions:
$0
Why Higher Margins Need a Lower Break-Even ROAS
Margin has a major effect on how much a business can afford to spend acquiring sales.
Consider three hypothetical businesses:
| Contribution Margin | Break-Even ROAS |
|---|---|
| 25% | 4.0X |
| 40% | 2.5X |
| 50% | 2.0X |
| 60% | 1.67X |
| 75% | 1.33X |
The relationship is important.
A business keeping only 25% of revenue before advertising needs substantially greater advertising efficiency than a business keeping 75%.
This is one reason comparing ROAS between businesses can be misleading.
Their underlying economics may be completely different.
A 3X ROAS Can Be Great—or Unprofitable
Consider two businesses generating exactly the same:
Revenue: $3,000
Ad spend: $1,000
Both report:
3.0X ROAS
Business A
Contribution margin before advertising:
60%
Contribution after non-advertising variable costs:
$1,800
After $1,000 of advertising spend:
$800 remains
Business B
Contribution margin before advertising:
25%
Contribution after non-advertising variable costs:
$750
After $1,000 of advertising spend:
−$250
Same revenue.
Same advertising spend.
Same 3X ROAS.
Very different economics.
That’s why there is no universal answer to:
“What is a good ROAS?”
Break-Even ROAS vs Target ROAS
Your break-even ROAS and target ROAS should not automatically be the same number.
Break-even represents the approximate point where profit reaches zero under the costs included in the calculation.
A business generally wants its target performance to leave room above that threshold.
For example:
Break-even ROAS: 2.0X
doesn’t automatically mean:
Target ROAS: 2.0X
Operating exactly at break-even leaves little room for changes in acquisition cost, refunds, discounts, fulfillment costs or other business expenses that weren’t included.
Your appropriate target depends on your economics and business objectives.
What Costs Should You Include?
Your calculation is only as useful as the inputs behind it.
Depending on the business, relevant variable costs might include:
- Cost of goods sold
- Packaging
- Shipping
- Fulfillment
- Payment processing
- Marketplace/platform fees
- Sales commissions
- Discounts
- Other costs directly associated with generating or fulfilling the sale
Not every business has the same cost structure.
You also need to distinguish variable economics from broader fixed business expenses when deciding what your particular profitability calculation is intended to measure.
Why Marketers Should Know Break-Even ROAS
Marketing platforms are very good at showing advertising metrics.
But the advertising platform doesn’t necessarily understand the complete economics of the business.
A media buyer might see:
and conclude that a campaign should be scaled.
But if the company’s break-even point is 3.5X, increasing spend could increase losses rather than profit.
Understanding break-even economics helps connect:
That’s particularly important when marketers and business owners make scaling decisions together.
What Happens When Your ROAS Is Below Break-Even?
It doesn’t automatically mean the campaign should immediately be turned off.
Context matters.
For example, a business might intentionally accept lower first-order profitability if repeat purchases produce sufficient customer value.
That requires understanding metrics such as customer lifetime value and customer acquisition cost.
But that is a different economic decision from assuming the first transaction itself is profitable.
The important thing is knowing why you’re operating below break-even and what assumptions make that strategy viable.
Break-Even ROAS and LTV
First-order ROAS becomes only one part of the picture when customers make repeat purchases.
A company may be willing to acquire customers near—or sometimes below—first-order break-even if future contribution from those customers justifies the acquisition cost.
That’s where LTV:CAC analysis becomes useful.
ProfitKit’s LTV CAC Calculator can help evaluate customer acquisition economics separately from individual campaign profitability.
The two concepts answer different questions:
Break-even ROAS:
How efficient does advertising need to be relative to the economics included in this transaction/campaign?
LTV:CAC:
How does the value generated by a customer compare with the cost of acquiring that customer?
Understanding both creates a more complete picture.
Calculate Your Campaign Economics
To put this threshold alongside your actual campaign costs, read how to calculate ad campaign profitability.
Instead of using a generic ROAS benchmark, evaluate your campaign using your own numbers.
ProfitKit’s Campaign Profit Calculator can help you examine the campaign profitability metrics supported by the current tool.
Use your actual advertising and business inputs rather than assuming that a particular ROAS is automatically good or bad.
Calculate your campaign profitability →
The Bottom Line
There is no universal “good ROAS.”
A 2X ROAS might be profitable for one business.
A 4X ROAS might be insufficient for another.
The number that matters starts with your own economics.
Understand your margins.
Understand your costs.
Know your break-even point.
Then decide what advertising performance your business actually needs.
Know your numbers. Grow with confidence.