How to Calculate Ad Campaign Profitability: Formula, Costs & Example
Revenue and ROAS don't tell the whole story. Learn how to calculate ad campaign profitability by accounting for ad spend, product costs, fees, fulfillment and other variable costs.
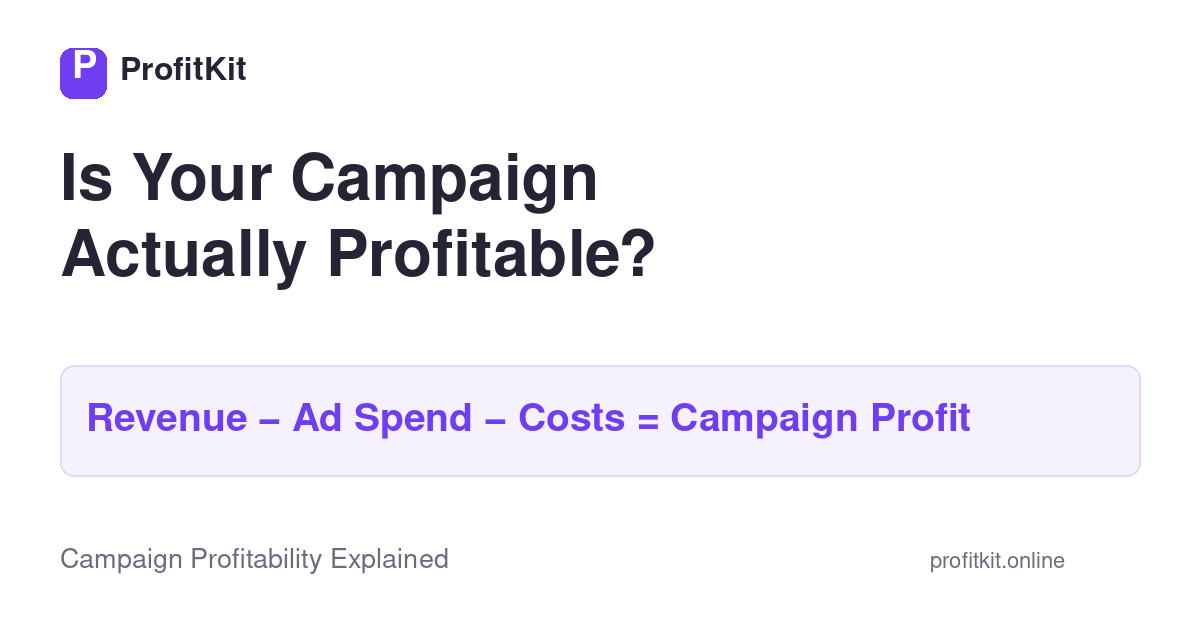
Your advertising dashboard says:
Revenue: $20,000
Ad spend: $5,000
ROAS: 4.0X
Was the campaign profitable?
Maybe.
Those three numbers aren’t enough to know.
Advertising creates revenue, but fulfilling those sales also costs money.
Products have costs. Payments have fees. Orders may require shipping and fulfillment.
To understand whether a campaign actually made money, you need to look beyond ROAS and calculate the economics behind the sales.
What Is Ad Campaign Profitability?
Ad campaign profitability measures whether the revenue attributed to a campaign exceeds the costs included in your analysis.
At its simplest:
The important part is determining what belongs inside campaign costs.
Ad spend is obvious.
But depending on the business, advertising may generate orders that also carry product, transaction and fulfillment costs.
Ignoring those costs can make campaign performance look much stronger than it really is.
Basic Advertising Profit Formula
A very simple calculation is:
For example:
Revenue: $10,000
Ad spend: $2,000
Advertising profit before other costs:
But calling that $8,000 actual business profit would usually be misleading if delivering those sales created additional costs.
A more useful simplified formula is:
Depending on the business, those variable costs might include:
- Cost of goods sold
- Packaging
- Shipping
- Fulfillment
- Payment processing fees
- Marketplace/platform fees
- Sales commissions
- Discounts or promotions
- Other costs directly associated with those sales
The exact calculation should reflect the economics you’re trying to measure.
Campaign Profitability Example
Consider a hypothetical e-commerce campaign.
The campaign produces:
Revenue: $20,000
Advertising spend:
$5,000
ROAS:
Looking only at the advertising platform, a 4X ROAS may appear strong.
Now add the costs associated with those orders.
Product costs: $7,000
Shipping and fulfillment: $2,000
Transaction/platform fees: $800
Total costs:
Campaign profit under this simplified example:
The campaign generated $20,000 in revenue, but the amount remaining after the costs included in this example is $5,200.
How to Calculate Campaign Profit Margin
Profit alone doesn’t tell you how large that profit is relative to revenue.
That’s where profit margin becomes useful.
A simplified formula is:
Using the previous example:
The simplified campaign profit margin is therefore:
26%
This provides additional context.
Two campaigns could generate the same dollar profit but have very different revenue levels and margins.
ROAS vs Campaign Profit
ROAS answers:
How much revenue did advertising generate for every dollar of ad spend?
Campaign profit answers:
How much money remained after the costs included in the calculation?
They aren’t competing metrics.
They measure different parts of performance.
For example:
Revenue: $20,000
Ad spend: $5,000
ROAS: 4.0X
Campaign profit after the costs in our hypothetical example: $5,200
The ROAS remains 4X regardless of those additional costs.
That’s why ROAS alone cannot tell you whether a campaign is truly profitable.
For a deeper explanation, read:
ROAS vs Profit: Why a High ROAS Doesn’t Always Mean You’re Profitable
Step 1: Determine Campaign Revenue
Start with the revenue attributed to the campaign during the period you’re analyzing.
Be consistent about attribution.
Different advertising and analytics platforms can attribute conversions differently, so make sure you understand which revenue figure you’re using.
Campaign tracking also matters.
Properly structured UTM parameters can make it easier to identify traffic sources and campaigns in your analytics setup.
ProfitKit’s UTM Builder can help create structured tracking URLs for campaigns.
Step 2: Add Advertising Spend
Next, determine how much was actually spent generating that revenue.
If you’re evaluating one campaign, use that campaign’s spend.
If you’re combining multiple advertising channels, clearly define the scope of the analysis.
For example:
Meta Ads: $3,000
Google Ads: $1,500
Other paid acquisition: $500
Total:
$5,000
The key is consistency between the revenue being measured and the advertising costs being compared against it.
Step 3: Calculate Product or Service Costs
For an e-commerce business, this often includes cost of goods sold (COGS).
If you sold 500 units and each unit cost $14 to acquire or manufacture:
For service businesses, the relevant cost structure may be different.
The objective is not to force every business into the same formula.
It’s to identify the costs directly associated with producing the revenue you’re evaluating.
Step 4: Include Relevant Variable Costs
Other costs may increase as sales increase.
Examples include:
Shipping and fulfillment
More orders may mean more packaging, shipping and warehouse costs.
Payment processing
Processors may charge fees based on transaction volume or value.
Marketplace/platform fees
Businesses selling through marketplaces may pay transaction or commission fees.
Sales commissions
Some businesses compensate salespeople or affiliates based on completed sales.
These costs can materially affect campaign economics.
Step 5: Calculate Profit
Once you’ve identified the relevant costs:
If:
Revenue = $20,000
Ad spend = $5,000
Other relevant variable costs = $9,800
Then:
That’s the amount remaining under the assumptions included in the calculation.
Step 6: Compare Against Your Break-Even Point
Profitability analysis becomes even more useful when you know your break-even advertising efficiency.
Break-even ROAS helps estimate the ROAS required for revenue to cover the costs represented by your margin assumptions.
We’ve covered this separately in:
Break-Even ROAS: How to Calculate the ROAS You Need to Be Profitable
Together, the metrics tell a clearer story:
- ROAS → advertising efficiency
- Break-even ROAS → profitability threshold
- Campaign profit → actual economics under your included costs
Common Campaign Profitability Mistakes
Looking only at ROAS
A high ROAS doesn’t automatically mean a profitable campaign.
Your cost structure determines what ROAS you actually need.
Treating revenue as profit
Generating $100,000 in sales doesn’t mean the business made $100,000.
Revenue is the starting point, not the final result.
Forgetting fulfillment costs
Shipping, packaging and fulfillment can materially change the economics of an order.
Ignoring transaction fees
Small percentages can become meaningful when transaction volume grows.
Comparing campaigns with different economics
Two campaigns may promote products with very different margins.
The campaign with the higher ROAS isn’t necessarily the campaign generating more profit.
Using inconsistent attribution
If your revenue number and advertising-spend number represent different attribution periods or scopes, the resulting profitability calculation may be misleading.
Should You Always Optimize for Immediate Campaign Profit?
Not necessarily.
Some businesses deliberately accept lower first-purchase profitability to acquire customers who may buy repeatedly.
That’s where customer lifetime value (LTV) and customer acquisition cost (CAC) become important.
A campaign could have weak first-order economics but still contribute to a profitable customer relationship.
However, that should be a deliberate decision supported by customer economics—not an assumption.
ProfitKit’s LTV CAC Calculator can help evaluate the relationship between customer value and acquisition cost using the inputs supported by the tool.
Campaign Profitability Before Scaling
Suppose a campaign is profitable at:
$100/day
Should you immediately increase it to:
$1,000/day?
Not necessarily.
Scaling can change:
- Acquisition costs
- Conversion rates
- Audience quality
- Channel mix
- Product mix
- Fulfillment economics
Before increasing spend, understand the current economics and continue monitoring them as scale changes.
Profitability isn’t something you calculate once and forget.
Calculate Your Campaign Profitability
You don’t need to rely on ROAS alone.
ProfitKit’s free Campaign Profit Calculator helps you analyze the campaign profitability metrics supported by the current V1 tool using your own numbers.
Calculate your campaign profitability →
No arbitrary industry benchmark can replace understanding your own economics.
The Bottom Line
Advertising performance isn’t just:
How much revenue did we generate?
The more useful question is:
What did it cost us to generate that revenue, and what remained?
Start with revenue.
Subtract advertising spend.
Account for the relevant costs.
Understand your margin.
Compare performance with your break-even economics.
Then make the decision to scale, optimize or reconsider the campaign.